What is a Business Intelligence Dashboard?

In this article, I am going to answer, What is a Business Intelligence Dashboard? How do you create a Business Intelligence Dashboard in Tableau? So, what is Business Intelligence, and additionally, why should you use dashboards?
- Business Intelligence (BI) allows the user to make informed business decisions based on data.
- A dashboard takes information from different data sources and displays it on one page. It is a high-level data analysis for your organization, from which you can get your insights.
You can create more than one dashboard based on the same data but with different focuses.
For example, you can have a dashboard for both the finance and marketing departments.
You can show hidden data visualizations (“vizzes”) if needed. This can help to create a more detailed yet still self-service Business Intelligence.
[ufwp id=”2956740″]
Loading data and creating reports
So, how easy is it to create these dashboards? It’s very easy in Tableau, which is a Business Intelligence tool.
First of all, you need to open your data sets in Tableau. These data sources may include:
- Real-time data from OLTP databases, either on-premises or online
- Data from data warehouses (OLAP)
- Web-based data, such as from Azure or financial data from Internet News sites
Complex data or big data may need extra processing in Tableau Prep before loading it into Tableau Desktop.
The Tableau Creator license includes this program.
You can create many data-driven reports, each containing a single viz once you load the data.
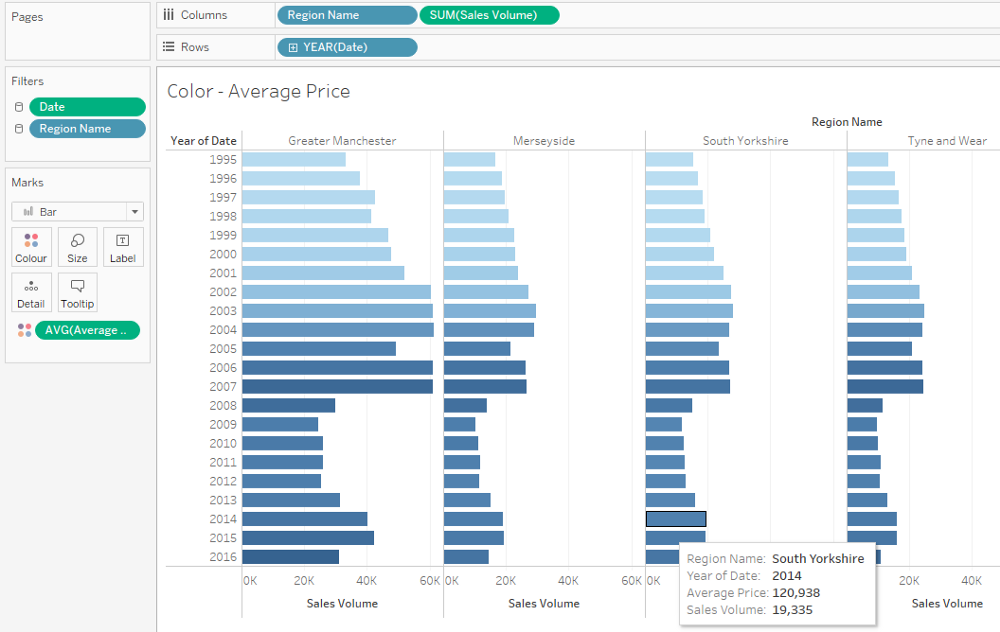
In the viz above, I have created a bar chart using House Price Data for six regions in England. From this viz, you can see:
- Which region has the highest or lowest house prices
- When house prices slumped
- How long it took to recover to 1995 levels
Want to know how to create these vizzes? My previous article, “ What is Tableau? Understanding an Analyst’s Most Important Tool,” shows you how you can create vizzes in a few minutes.
Creating dashboards | Business Intelligence Dashboard
These individual BI reports can give you some insights, but only into one aspect of your business at a time.
By combining your vizzes, you can create high-level dashboards.
BI dashboards will generally combine many different types of visualizations, such as:
- Tables
- Bar, area, or line charts
- Maps
- Gauges
- Bubble charts (or scatter graphs)
- Box-and-whiskers plots.
[ufwp id=”2135486″]
You can also add reference lines on your vizzes, such as:
- Your targets
- Where you have been over the last few months
- The trend
- Your forecast over the next few months
You should first of all set up an initial draft of your BI Dashboards in Tableau.
If you concentrate on what message you want your dashboards to give, you can then decide how to show that message through your dashboard.
If you can go through such a process, then you will be able to have a coherent message.
It is important to pre-design your dashboard, even in your head, so that you can enable your vizzes to flow well.
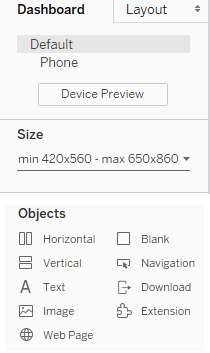
To help with this are these options in the Dashboard pane:
- you can add horizontal and vertical sections, separating your dashboard into several pieces.
- you can specify how big your dashboard will be. It can then fit your business user’s screen, whether it is a laptop, tablet, or mobile.
- you could even have several different layouts for different devices.
Filtering and highlighting | Business Intelligence Dashboard
Your dashboard looks at your data at a company- or department-level.
You can then allow the end-user to focus on specific items — this can make it a powerful BI dashboard. We call this:
- “Filtering,” which allows you to temporarily hide data other than your chosen category, and
- “Drill through,” which takes you to separate vizzes or dashboards.
Both of these allow you to create interactive dashboards.
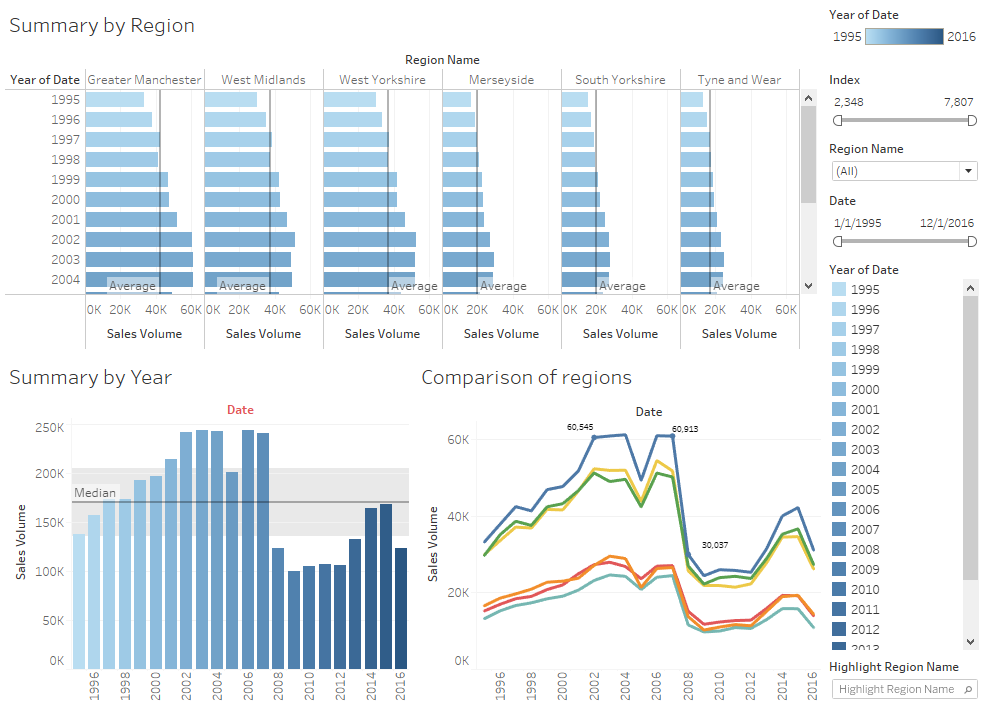
There are two main ways of creating a filter. In the dashboard that I made above, the right-hand side shows my filters from the individual vizzes.
If I click on or alter the settings for any filter, the dashboard would react. For example, if I want to concentrate on the years 2000 to 2009, I could adjust my date slider.
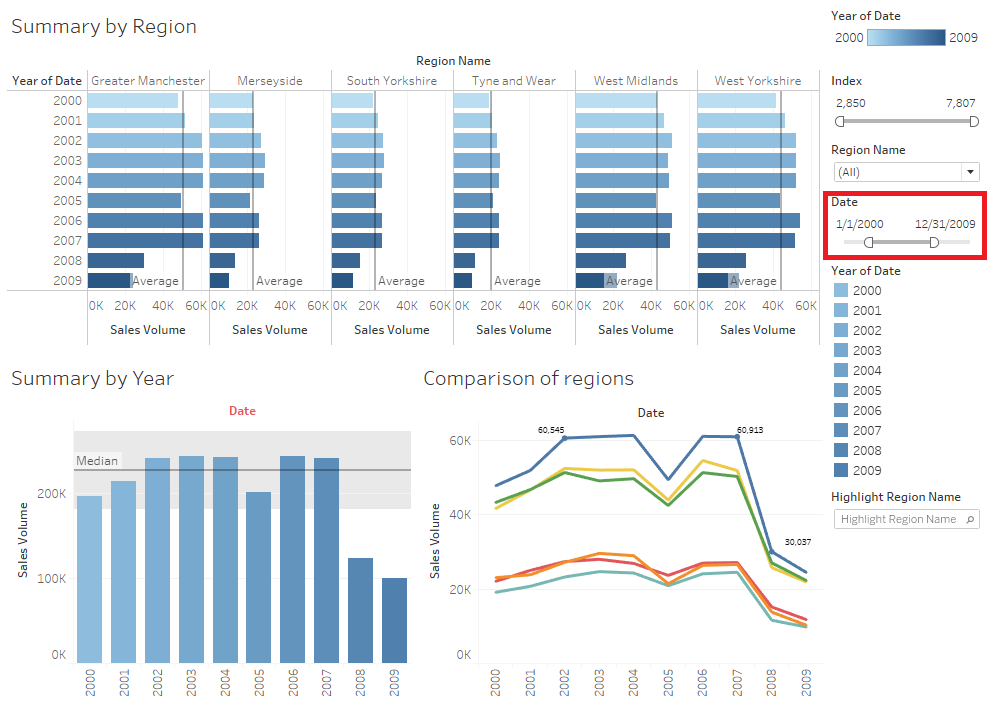
The vizzes have changed to show the years 2000 to 2009.
I can also set up a viz to act as a filter by clicking on it and then clicking on “Use as filter.”
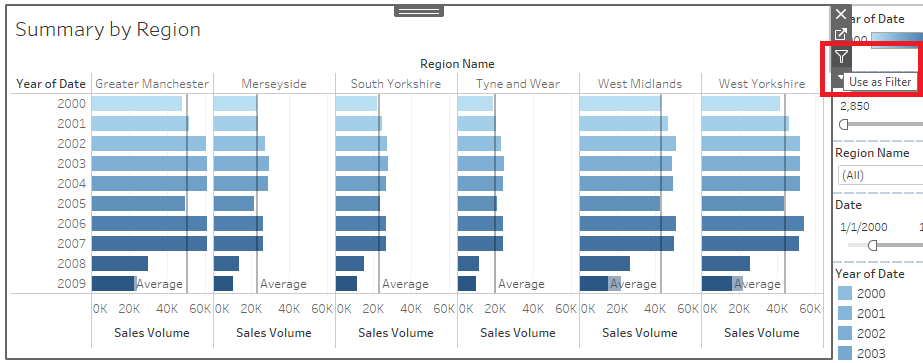
With this enabled, any click with this viz changes the rest of the dashboard. Let’s click on Greater Manchester in the year 2002.
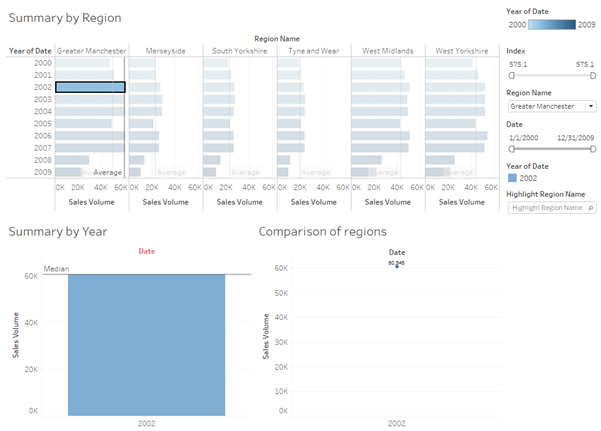
Now my focus is on just one year for one region. However, the dashboard is not as useful as before because the two bottom vizzes show only one data point.
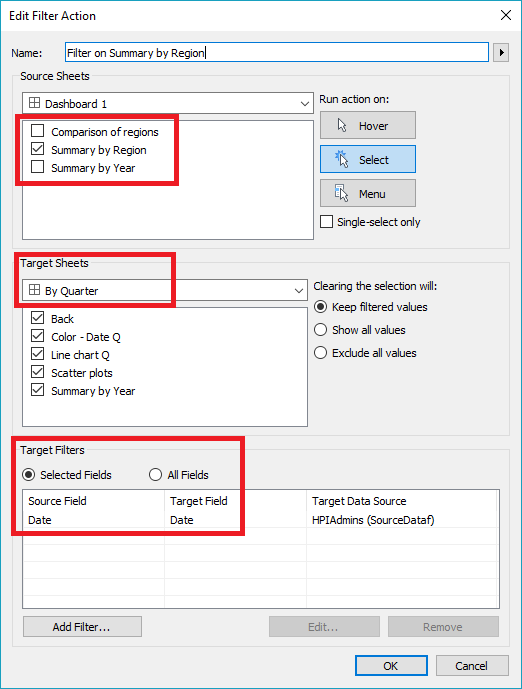
It would be more useful if I could drill down to a per-quarter or per-month view. You can add this drill-down functionality by using Actions. To do this:
- Remove the “Use as filter” from the viz.
- Go to Dashboard — Actions and then go to Add Action — Filter.
- You can then select:
- Which vizzes you want to use for your action
- Where you want the action to lead to
- What fields you want to filter on in the target dashboard
If I now click on a bar in the year 2002, Tableau opens a different dashboard.
[ufwp id=”295981″]
This dashboard is designed to focus on a single year and includes a bar chart showing different quarters within the year, together with a scatter graph.
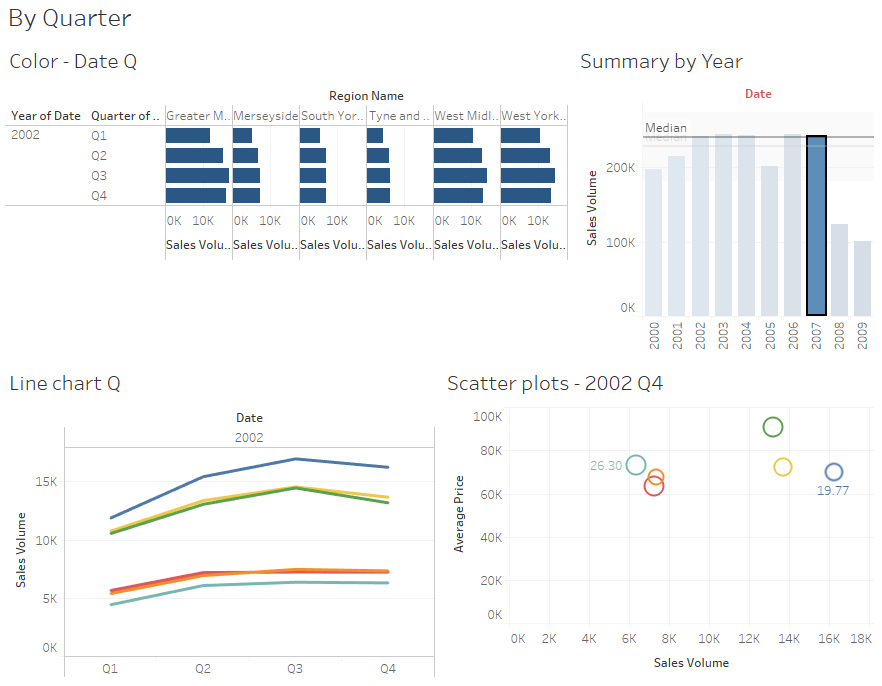
This drill-through functionality can make it easier for the end-user to explore the data and then make business decisions.
Publishing your BI Dashboard
After you have created your dashboard, you can publish it on a cloud-based server. There are several places to do this:
- Firstly, you could publish it to Tableau Public. This is a free online server. However, as it is a public server, this would not be a good idea if you include sensitive data in your dashboard.
- If you have Tableau Creator, you can publish your dashboard to either Tableau Online or Tableau Server.
With either paid-for service, you have the option to publish BI dashboards on a secure cloud-based server.
So,You can also add security so that only certain employees can use it.
Next steps
I hope that you have enjoyed reading this article.
Would you like more information on how to create your data reports, dashboards, and more?
Then, why not join me in my Tableau course on Udemy.
It follows the requirements of the official Tableau certification. After completing the lessons, and with a bit more practice, you could enter (and hopefully pass) the official Tableau exams.
Wouldn’t that certification look good on your CV or resume?
The principles behind creating dashboards are similar in other Business Intelligence programs.
For example, you can use the principles in this article with Power BI as well. For more information about both Power BI and Tableau, please see my previous article, “ Power BI vs. Tableau — Which One Should I use? “.
Whatever you choose to do, I hope you will look at creating dashboards for yourself and your company.
In just a few minutes, you can make complex data look easy to understand.
Thank you very much for reading this, and keep learning!
More courses for Business Intelligence Dashboard
[ufwp search=”Business Intelligence Dashboard” items=”6″ template=”grid” grid=”3″]