CCNP Data Center 300-615 [DCIT] Cisco Certified Specialist


The Troubleshooting Cisco Data Center Infrastructure v1.0 (DCIT 300-615) exam is a 90-minute exam associated with the CCNP Data Center and Cisco Certified Specialist – Data Center Operations certifications. This exam certifies your knowledge of troubleshooting a data center infrastructure including network, compute platforms, storage network, automation, management and operations.
This exam tests your knowledge of troubleshooting a data center infrastructure, and that includes the following areas.
- Network
- Compute platforms
- Storage network
- Automation
- Management and operations
After passing out this course, you re expected to be strong in following qualities.
- Describe how to troubleshoot the data center network, troubleshooting tools and methodologies available from the CLI that are used to identify and resolve issues in a Cisco data center network architecture
- Identify and resolve issues that are related to: VLANs and private VLANs; port channels and virtual port channels; Overlay Transport Virtualization (OTV); and Virtual Extensible LAN
- Describe troubleshooting of routing protocols such as OSPF, EIGRP, PIM, and LAN security features
- Identify and resolve issues that are related to a single device
- Identify and resolve issues that are related to Fibre Channel interface operation
- Identify and resolve Fibre Channel switching issues when the Cisco NX-OS Software is used in switched mode, and in NPV mode
- Identify and resolve issues that are related to Fibre Channel over Ethernet and FCoE Initialization Protocol (FIP), including FCoE performance
- Describe Cisco UCS architecture, initial setup, tools, and service aids
- Describe Cisco UCS configuration, Cisco UCS B-Series Blade Server operation and troubleshoot related issues
- Describe LAN, SAN, and Fibre Channel operations, including in-depth troubleshooting procedures
- Describe Cisco Integrated Management Controller (IMC) tools for validating performance and facilitating data-gathering activities for Cisco UCS C-Series server troubleshooting, and the troubleshooting approach for hardware and firmware failures
- Define the proper procedures for configuring LAN and SAN connectivity, avoiding issues with the VIC, troubleshooting connectivity issues and Cisco UCS C-Series server integration with Cisco UCS Manager
- Identify the tools, protocols, and methods to effectively troubleshoot Cisco ACI
- Describe how to troubleshoot automation, scripting tools, and programmability
When you pass out this exam CCNP Data Center 300-615 You can expect to learn how to do the following
- Troubleshoot data center components such as Cisco Nexus 9000, 7000, and 5000 Switches, and Multilayer Director Switches (Cisco MDSs).
- Troubleshoot Cisco Nexus 2000 Fabric Extenders (FEXs).
- Troubleshoot Cisco Unified Computing System (Cisco UCS) Servers.
The exam CCNP Data Center 300-615 is useful to the followings
- Network designers, administrators, engineers, and managers
- System engineers
- Data center engineers
- Consulting systems engineers
- Technical solutions architects
- Server administrators
- Cisco integrators and partners

Let’s Learn some of the topics of the CCNP Data Center 300-615 exam. and at the end of the class, you will find the Q & A
1.1 Introduction to CCNP Data Center 300-615. Describing the Troubleshooting Process
Whenever you are into a troubleshooting task, you should optimize your strategy by employing appropriate methodology and should use the most effective tools to gather evidence based on the observed symptoms. Asking the right questions and following a structured and systematic process will ensure the best results.
Even if you verify several aspects, such as physical ports, Layer 2 and Layer 3 connectivity, or any diversities that are related to software upgrades and configuration management, it may not be possible that the issue is resolved. but at least you should gather enough information to provide the necessary details when opening a case with the Cisco Technical Assistance Center (TAC).
In this first topic, you are going to learn about the troubleshooting process. The first thing that we’re going to do here, is identify where exactly the problematic area is located, make a clear statement about where the problem is like, is this an individual user? Is this a subnet or a VLAN or a group? Or is this actually enterprise-wide? Is this the entire organization? defining this will help you first to get enter into taking the first step towards the solution.
Once you find that out, you are going to move to gather the information. This is where you are going to use show commands, debug commands, and logging messages to try and get a better idea of what actually occurred and building the outline of how to resolve it. then you are going to take all that information, create a possible list of some of the culprits that could cause this. A very common one, is, for instance, if somebody added something new to the network. And it’s just not jiving with what we’ve currently got. So what our action plan is that we will create.
We want to be able to ensure that whenever we do implement a fix, it doesn’t break anything else. Once we feel comfortable with that, let’s go ahead and move around into implementing that action plan. This is where you are possibly going to roll back a configuration that was recently implemented. Or this could be as simple as you are turning on a port.
What you then going to do is record those specific changes. Now, the reason why you want to do this, you may go through this cycle more than once. And the reason that you really want you to document this because even if it doesn’t work this time, it may work in the future.
So a lot of the time what I’ll see is in older trouble tickets, I’ll see three or four attempts. And the one that worked in the past may not actually be working for me now. Now, I have a platform to try other resolutions without having to arise or go ask for more information.
So then what you are going to do is analyze those results and see, did it actually in fact resolve the problem? If it didn’t solve the problem, we’re going to have to eliminate that specific variable that we just changed. And then start with creating a new fresh action plan again. keep in mind, that once the problem is finally solved, we definitely need to document it. So please keep in mind, we document when the solution works and when it doesn’t, both the times.
Now, there’s a couple of different methods that we can use to troubleshoot. We need to use the Top-Down methodology, which usually starts with the application layer and then goes down to the network, data link, and then physical. Whereas the Bottom-Up methodology, that’s the physical layer. check, Is it plugged in? Then to go the data link layer. So in this, we’re starting from the bottom and going up. This is very traditional, and this is the one that I prefer because it starts right with where the issue is.
Then Divide-and-Conquer. This is another favorite of mine because what I’m doing is I feel comfortable with my environment. I know about where everything’s located. So what I’m going to do first, I’m going to check the network. That’s right. I’m going to start by checking Layer 3. Let’s make sure that default gateways, default routes are installed. Then go check switching and VLANs, then physical connectivity. And as long as my network looks good, I’m going to go ahead and start moving up the stack to the actual application that’s currently the problem area.
But that’s not the only thing that we can do here. Another very, very, very popular method I guess you could say is follow the leader or Follow-the-Path, as I like to say. Because what you’re doing is you’re starting from the end user. And starting with, let’s say, is the network interface card enabled and blinking? Then move up, follow the path that the traffic would normally take, so it would hit a specific port on a switch. So let’s go check that port. Let’s go check that switch. Then moving up to the router, check your Layer 3.
It looks like in this example, folks, that actually there may be some sort of issue between the router and the internet. This could be a service provider issue. Or this could be your issue. But it really zeros in on where that issue is located.
Another example here that we could use as a troubleshooting method is swapping devices. If you feel like the device is going bad or you’ve exhausted all configuration options, you may want to move to a piece of new hardware. Simply copy that old configuration from the old device, paste it onto the new one, let’s plug it in, and see if it resolves the issue.
One of the last ones we talk about here is a comparison. A lot of the time when you have two edge devices, let’s say maybe HSRP, Hot Standby Cluster, those two devices are configured exactly the same. So if one side goes offline or is having an issue, let’s go ahead and compare those configurations and see if we can find why those two devices that are supposed to be acting identical are not.
Now, let’s see a little bit more about the general troubleshooting process. So the first thing, one of the things that can make troubleshooting much more efficient is having a consistent operating system. This is very much important. You don’t want to keep track of 16 different operating systems and bugs and release notes. You want to make sure that everybody, if possible, is running the same operating system and version.
Then, also, as always, we should be enabling system messages, such as system logging. This is available on every device. So why not enable it and allow that device to talk back to you when it identifies an issue?
Now, the big one, maintain an up-to-date topology for your network. I cannot tell you how important this is for documentation to be correct and bulletproof. So if there’s a change, please make sure that you signify that change inside your topology.
Then, check release notes. Check bugs, limitations, caveats. Verify that the operating system that you currently have is not actually part of a limitation or has a current bug that needs to be fixed. And also, if there is a bug, maybe there is a fix on that release note.
Now, moving forward a little bit more deeper here, troubleshooting new configuration items, this is incredibly important. One of the first things I ask my customers when they call in with a trouble ticket since I’m on the network side, the first thing I ask is, well, the network doesn’t change on its own, what changed? So changing the network, implementing a new change is always going to come with some sort of drawback or issue. So a lot of the time let’s look at that new device, zero in on where that issue is, and see if we can resolve it there.
But, as always, gather as much information as possible with your show, debug, and logging commands. And don’t forget to backup your configuration. We’re going to be talking about that here in just a moment.
Now, the standard stuff– verifying physical connectivity. Make sure it’s plugged in. Also, Layer 2 connectivity, make sure that VLANs are on the proper ports and on the proper trunks. But also verify that the Layer 2 switch is actually, in fact, learning the correct MAC addresses. Then also verify end-to-end connectivity. For instance, your default gateway or your default route, and your IP routing table, ensure that the routes that are required for your internal network are there and you’ve got a default route out to the internet.
Now, with that being said, how are we going to do that? Well, here’s some just generalized commands that we could use here. So, for instance, show module, this is going to give us a lot of Layer 1 information, verifying that interfaces are still online, the module is still online. Very, very important.
But another big one is show version. This is going to give you a really big one that’s kind of overlooked quite often. Uptime, how long has this device actually been online? You may also want to do a show run. For some of the more seasoned veterans, they have the ability to just look at a running-config and go, that’s the problem, I know where we need to target.
Show interface brief is fantastic, because it’s going to give me up down status in a very brief output, which I like very much. Show spanning-tree, that’s always going to be an issue. With show spanning-tree, folks, it’s going to give you all your VLAN information and what spanning tree type you’re running. And this is very important because sometimes spanning tree types don’t match up so well.
Another big one is show ip route. This is our routing table. This is going to display your default gateway in any internally learned routes.
Show process and show accounting, this is for what’s going on underneath the hood. So, for instance, show process, that’s going to show you processes running on the processor. Show accounting, that’s going to let you know when somebody’s logged in and what they changed. Again, all of these are really zooming into specific areas of the device.
The next thing we want to talk about here is let’s zero in ourselves. Layer 2, no, we want to do a show VLAN. The Layer 2 VLAN construct is incredibly important to be on the correct downstream port to the client and on trunk ports. This is incredibly important, folks.
With that being said, those trunk links, they’re usually port channeled. This is very important to do a show port channel summary. This is going to identify if you’re having any, you know, port channeling issues, mismatches, one side’s down, one side’s up. You can also do a show port channel compatibility parameter. And again, this is going to tell you if each side of the port channel is in compliance.
Show run span tree, this is a fantastic command, because this is going to show you anything that you’ve changed in a running configuration format with regards to spanning tree. Very, very useful. Show spanning-tree blockedports also very useful. It’s going to tell you if any interfaces are actually turned off because spanning tree has blocked them. This could be bad, especially if one of your port channels are currently blocked upstream.
And then last but not least here for Layer 2, the show mac address-table dynamic. This is going to show us any MAC addresses that are being learned on a device from downstream clients.
Now, Layer 3, show IP interface, show IP arp, show IP route, these are all commands that we’ve already talked about. But show IP interface and show IP interface brief, these are going to give us up down status, IP information, and interface identification. Very, very important.
Show IP route, again, it’s going to show you all the routes that the device knows about, but also your default gateway and your default routes. So note that second box down here says verify the default route and the default gateway configuration. But also, check ACLs, check route maps. ACLs and route maps and filters a lot of the time can actually misidentify traffic and send it to the wrong destination, thus causing probably a significant issue. Also note, check if policy routing is configured. If policy routing is configured, we want to verify that the next hop information is correct.
Now, narrowing down the cause of the problem, again this is kind of a generalized idea here. But verify physical connectivity. Check Layer 2 and Layer 3. And verify that the topology is plugged in correctly. Rule out common mistakes or missing configuration parameters.
Also, they say ask the right questions, or asking the right questions, will help you focus your effort on the areas that are most likely to produce the result. Remember, in the beginning of this video, I mentioned scoping out the issue, clearly identifying the problem, this is where you folks are going to ask the question of is this affecting anyone else? And if so, we can start to identify where or who is being affected by this issue. And again, that’s going to allow it to zero down into what exactly created that issue and possibly how to resolve it.
Then, make sure that when you’re gathering all of this information, you’re preparing it or you’re storing it in a location that you can then send this right off to Cisco. When you’re ready to escalate or create a ticket with Cisco Tech, you have it all at your fingertips.
Now, what about software upgrade issues or software issues altogether? The show installs all, show sys internal, and show logging, these are going to let you know if any sort of changes has been made to the software of this device. And this is very important to look at. Not something that happens all of the time, but still very important to look at.
And the last thing I want to talk about here, folks, is the most probably important piece here. And that’s saving the configuration– storing the configuration in a remote location and backing it up. You can see here we’ve got a copy startup-config scp. That’s going to copy your startup configuration over to a secure copy server, so that in the event that the configuration ever gets blown away, we can absolutely bring it back down and restore that configuration.
1.2 Describing the Troubleshooting Process
Troubleshooting Overview
In this topic, we’re going to describe the troubleshooting process. The first thing that we’re going to want to do here, folks, is identify where exactly the issue is located, make a clear statement about where the problem is. So is this an individual user? Is this a subnet or a VLAN or a group? Or is this actually enterprise-wide? Is this the entire organization?
Once we figured that out, we’re going to move to gathering information. This is where you folks are going to use show commands, debug commands, and logging messages to try and get a better idea of what actually occurred and possibly how to resolve it. We’re going to then take all that information, create a likely list of some of the culprits that could cause this. A really good one that’s very common, for instance, is somebody added something new to the network. And it’s just not jiving with what we’ve currently got. So what we’re going to do is we’re going to create an action plan.
We want to be able to ensure that whenever we do implement a fix, it doesn’t break anything else. Once we feel comfortable with that, let’s go ahead and move around into implementing that action plan. This is where you folks are possibly going to roll back a configuration that was recently implemented. Or this could be as simple as you folks turning on a port.
What we’re then going to want to do is record those specific changes. Now, the reason why we want to do this, you may go through this cycle more than once. And the reason that we really want you to document this right off the bat is even if it doesn’t work this time, it might work in the future.
So a lot of the time what I’ll see is in older trouble tickets, I’ll see three or four attempts. And the one that worked in the past may not actually be working for me now. Now, I have a platform to try other resolutions without having to go escalate or go ask for more information.
So then what we’re going to do is analyze those results and see, did it actually in fact resolve the issue? If it did not, we’re going to have to eliminate that specific variable that we just changed. And then start with creating an action plan all over again. Again, please keep in mind, folks, that once the problem is finally resolved, we definitely want to document it. So please keep in mind, we document when the solution works and when it doesn’t.
Now, there’s a couple of different methods that we can use to troubleshoot. We’ve got the Top-Down methodology, which usually we start with the application layer and then weave our way down to network, data link, and physical. Whereas the Bottom-Up methodology, that’s the physical layer. Is it plugged in? Then to the data link layer. So we’re starting from the bottom and going up. This is very traditional, and this is one of the ones that I like very much, because it starts right with where the issue is.
Then Divide-and-Conquer. This is another favorite of mine because what I’m doing is I feel comfortable with my environment. I know about where everything’s located. So what I’m going to do first, I’m going to check the network. That’s right. I’m going to start by checking Layer 3. Let’s make sure that default gateways, default routes are installed. Then go check switching and VLANs, then physical connectivity. And as long as my network looks good, I’m going to go ahead and start moving up the stack to the actual application that’s currently at fault.
But that’s not the only thing that we can do here. Another very, very, very popular method I guess you could say follows the leader or Follow-the-Path, as I like to say. Because what you’re doing is you’re starting from the end-user. And starting with, let’s say, is the network interface card enabled and blinking? Then move up, follow the path that the traffic would normally take, so it would hit a specific port on a switch. So let’s go check that port. Let’s go check that switch. Then moving up to the router, check your Layer 3.
It looks like in this example, folks, that actually there may be some sort of issue between the router and the internet. This could be a service provider issue. Or this could be your issue. But it really zeros in on where that issue is located.
Another example here that we could use as a troubleshooting method is swapping devices. If you feel like the device is going bad or you’ve exhausted all configuration options, you may want to move to a piece of new hardware. Simply copy that old configuration from the old device, paste it onto the new one, let’s plug it in, and see if it resolves the issue.
One of the last ones we talk about here is a comparison. A lot of the time when you have two edge devices, let’s say maybe HSRP, Hot Standby Cluster, those two devices are configured exactly the same. So if one side goes offline or is having an issue, let’s go ahead and compare those configurations and see if we can find why those two devices that are supposed to be acting identical are not.
Now, a little bit more on the general troubleshooting process. So the first thing, folks, one of the things that can make troubleshooting much more efficient is having a consistent operating system. This is incredibly important. You don’t want to keep track of 16 different operating systems and bugs and release notes. You want to make sure that everybody, if possible, is running the same operating system and version.
Then, also, as always, we should be enabling system messages, such as sysloging. This is available in pretty much every device. So why not enable it and allow that device to talk back to you when it identifies an issue?
Now, the big one, maintain an up-to-date topology for your network. Folks, I cannot tell you how important this is for documentation to be correct and bullet proof. So if there’s a change, please make sure that you signify that change inside your topology.
Then, check release notes. Check bugs, limitations, caveats. Verify that the operating system that you currently have is not actually part of a limitation or has a current bug that needs to be fixed. And also, if there is a bug, maybe there is a fix on that release note.
Now, moving forward a little bit more information here, troubleshooting new configuration items, this is incredibly important. One of the first things I ask my customers when they call in with a trouble ticket, since I’m on the network side, the first thing I ask is, well, the network doesn’t change on its own, what changed? So changing the network, implementing a new change is always going to come with some sort of drawback or issue. So a lot of the time let’s look at that new device, zero in on where that issue is, and see if we can resolve it there.
But, as always, gather as much information as possible with your show, debug, and logging commands. And don’t forget to backup your configuration. We’re going to be talking about that here in just a moment.
Now, the standard stuff– verifying physical connectivity. Make sure it’s plugged in. Also, Layer 2 connectivity, make sure that VLANs are on the proper ports and on the proper trunks. But also verify that the Layer 2 switch is actually, in fact, learning the correct MAC addresses. Then also verify end-to-end connectivity. For instance, your default gateway or your default route, and your IP routing table, ensure that the routes that are required for your internal network are there and you’ve got a default route out to the internet.
Now, with that being said, how are we going to do that? Well, here’s some just generalized commands that we could use here. So, for instance, show module, this is going to give us a lot of Layer 1 information, verifying that interfaces are still online, the module is still online. Very, very important.
But another big one is show version. This is going to give you a really big one that’s kind of overlooked quite often. Uptime, how long has this device actually been online? You may also want to do a show run. For some of the more seasoned veterans, they have the ability to just look at a running-config and go, that’s the problem, I know where we need to target.
Show interface brief is fantastic, because it’s going to give me up down status in a very brief output, which I like very much. Show spanning-tree, that’s always going to be an issue. With show spanning-tree, folks, it’s going to give you all your VLAN information and what spanning tree type you’re running. And this is very important because sometimes spanning tree types don’t match up so well.
Another big one is show ip route. This is our routing table. This is going to display your default gateway in any internally learned routes.
Show process and show accounting, this is for what’s going on underneath the hood. So, for instance, show process, that’s going to show you processes running on the processor. Show accounting, that’s going to let you know when somebody’s logged in and what they changed. Again, all of these are really zooming into specific areas of the device.
The next thing we want to talk about here is let’s zero in ourselves. Layer 2, no, we want to do a show VLAN. The Layer 2 VLAN construct is incredibly important to be on the correct downstream port to the client and on trunk ports. This is incredibly important, folks.
With that being said, those trunk links, they’re usually port channeled. This is very important to do a show port-channel summary. This is going to identify if you’re having any, you know, port channeling issues, mismatches, one side’s down, one side’s up. You can also do a show port-channel compatibility parameter. And again, this is going to tell you if each side of the port channel is in compliance.
Show run span tree, this is a fantastic command, because this is going to show you anything that you’ve changed in a running configuration format with regards to spanning tree. Very, very useful. Show spanning-tree blockedports also very useful. It’s going to tell you if any interfaces are actually turned off because spanning tree has blocked them. This could be bad, especially if one of your port channels are currently blocked upstream.
And then last but not least here for Layer 2, the show mac address-table dynamic. This is going to show us any MAC addresses that are being learned on a device from downstream clients.
Now, Layer 3, show ip interface, show ip arp, show ip route, these are all commands that we’ve already talked about. But show ip interface and show ip interface brief, these are going to give us up down status, IP information, and interface identification. Very, very important.
Show IP route, again, it’s going to show you all the routes that the device knows about, but also your default gateway and your default routes. So note that the second box down here says to verify the default route and the default gateway configuration. But also, check ACLs, check route maps. ACLs and route maps and filters a lot of the time can actually misidentify traffic and send it to the wrong destination, thus causing probably a significant issue. Also note, check if policy routing is configured. If policy routing is configured, we want to verify that the next-hop information is correct.
Now, narrowing down the cause of the problem, again this is kind of a generalized idea here. But verify physical connectivity. Check Layer 2 and Layer 3. And verify that the topology is plugged incorrectly. Rule out common mistakes or missing configuration parameters.
Also, they say to ask the right questions, or asking the right questions, will help you focus your effort on the areas that are most likely to produce the result. Remember, at the beginning of this video, I mentioned scoping out the issue, clearly identifying the problem, this is where you folks are going to ask the question of is this affecting anyone else? And if so, we can start to identify where or who is being affected by this issue. And again, that’s going to allow it to zero down into what exactly created that issue and possibly how to resolve it.
Then, make sure that when you’re gathering all of this information, you’re preparing it or you’re storing it in a location that you can then send this right off to Cisco. When you’re ready to escalate or create a ticket with Cisco Tech, you have it all at your fingertips.
Now, what about software upgrade issues or software issues altogether? The show install all, show sys internal, and show logging, these are going to let you know if any sort of changes have been made to the software of this device. And this is very important to look at. Not something that happens all of the time, but still very important to look at.
And the last thing I want to talk about here, folks, is the most probably important piece here. And that’s saving the configuration– storing the configuration in a remote location and backing it up. You can see here we’ve got a copy startup-config SCP. That’s going to copy your startup configuration over to a secure copy server so that in the event that the configuration ever gets blown away, we can absolutely bring it back down and restore that configuration.
The data center infrastructure serves a diverse set of applications with different requirements and performance levels. The task of the network engineer is to ensure physical, Layer 2, and Layer 3 connectivity for all the applications. Each failure in the network has certain characteristic symptoms.
The first troubleshooting task is to correctly identify the symptoms of problems in the data center network. After you have determined that the symptoms point to network problems, you have to identify the problems and then the potential solutions.
The best way to approach network troubleshooting is to use a systematic approach:
- Clearly understand and define the observed symptoms.
- Identify potential problems that might cause these symptoms.
- Systematically work on each potential problem and eliminate them one by one.
- Verify that the symptoms have disappeared. Proceed with eliminating any additional problems until all symptoms disappear or you have exhausted all potential causes.
Using an unsystematic approach can waste time and resources, and lead to worsening of the symptoms. The structured model is not a rigid guideline that you must follow under all circumstances. It provides the framework that works best in most problem-solving scenarios. As you gain experience with your network, equipment, software, and features, you will be able to modify the recommended approach to best suit your needs.
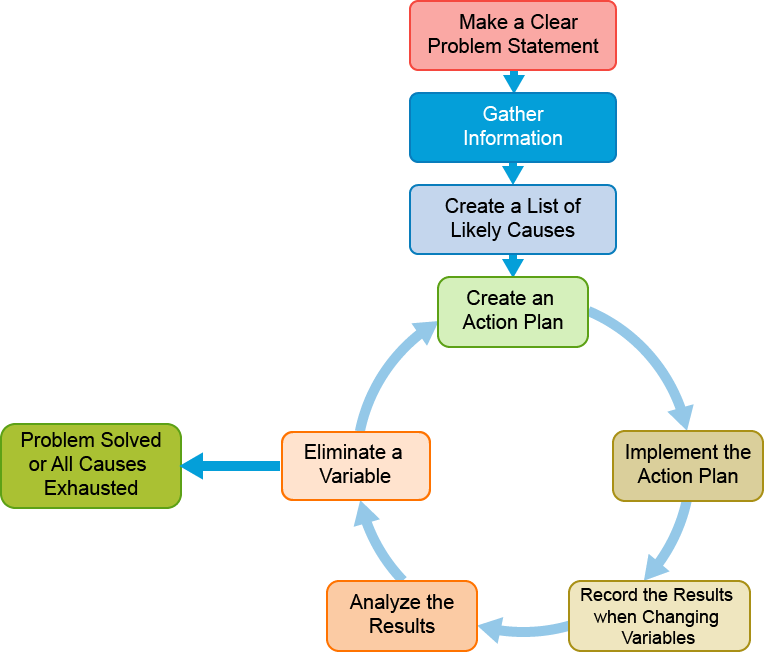
Use the following steps when troubleshooting network issues:
- Develop a clear problem statement: When troubleshooting issues, you first identify the symptoms and based on them, determine potential causes. This process helps in answering the most important question—is the problem network-related? If you determine that the problem is network-related, proceed with identifying the causes. You may find that the cause is trivial, such as a disconnected or an incorrectly connected cable, or it might be much more complex, such as problems in the protocol interaction or a bug.
- Gather information: Investigate and gather all the facts that you need to isolate the problem. Use all the tools that you have, such as CLI commands, logs, debug outputs, traffic captures, and so on. Make sure that you clearly understand the symptoms. Interview the affected users and ask them appropriate questions. Confirm that you can observe the symptoms that other people describe. Sometimes you will get network problem reports from people who are not experts in data center networking, and their understanding of symptoms may not accurately describe what is really occurring. Compare network behavior with benchmarks. Ask the following questions: “Is this expected behavior?” and “How does this behavior compare with the normal state?”
- Create a list of likely causes: Use the information that you have gathered to quickly eliminate unlikely causes and focus on likely problem areas. Use the list of likely causes to create an effective action plan. During the troubleshooting process, eliminating unlikely causes with great certainty is as important as identifying likely causes. This elimination process helps accelerate the troubleshooting and makes the procedure more efficient.
- Create an action plan: Make sure that you have a clear understanding of the troubleshooting steps that you intend to take. Begin with the most likely cause of the problem and proceed with each subsequent cause. Be careful to always include only a single variable in each step of your action plan. This approach helps you reproduce the exact conditions that resulted from the changed variable, and pinpoint the solution. When you isolate a change in the variable that removed the symptoms, you will be certain that you have found the exact correlation between the changed variable and the changes in symptoms. Changing several variables at the same time may help you solve the problem, but it will make it difficult to identify which of the variables was responsible for the removal of symptoms. This action will not help you cope with and solve similar problems in the future. If you successfully solve the problem by changing several variables simultaneously, revisit the problem later, and try to isolate how specific variable changes affect the symptoms. Use this knowledge when the symptoms reappear.
- Implement the action plan: Carefully perform each step of your action plan and see if the symptoms disappear.
- Record the results: Make sure that you gather and record the results from each step of your action plan implementation. Each time that you change a variable, execute CLI commands, and gather relevant data from available diagnostic tools to determine if the symptoms have changed. Always use the same method of gathering data and compare results with the previous steps and benchmarks.
- Analyze the results: Compare the results with the expected behavior. If the results show that the problem has been resolved, the troubleshooting process is complete.
- Eliminate a variable: If the change in variable did not resolve the problem, you must eliminate the variable from potential causes. Proceed with the next likely cause in your action plan. Go back to the step where you create an action plan and create a new action plan for the next cause and perform all additional steps. Repeat the process until you have exhausted all potential causes. When you have exhausted all causes, consider contacting Cisco TAC.
Troubleshooting Methods
Several different, structured, troubleshooting approaches exist, and the approach to use may be chosen depending on the problem.

The most common troubleshooting methods are as follows:
- Top-down method: Work from the application layer in the Open Systems Interconnection (OSI) model down to the physical layer. The top-down method uses the OSI model as a guiding principle. One of the most important characteristics of the OSI model is that each layer depends on the underlying layers for its operation. This structure implies that if you find that a layer is operational, you can safely assume that all underlying layers are fully operational as well.
- For example, suppose that you are researching the problem of a user who cannot browse a particular website. You find that you can establish a TCP connection on port 80 from this host to the server and get a response from the server. Based on this information, you can typically conclude that the transport layer and all layers below must be fully functional between the client and the server. It is most likely a client or server problem and not a network problem.
- In this example, it is reasonable to conclude that Layers 1 through 4 are fully operational, but this idea is not definitively proved. For example, unfragmented packets might be routed correctly, while fragmented packets are dropped. The TCP connection to port 80 might not uncover such a problem. Therefore, the goal of this method is to find the highest OSI layer that is still working. All devices and processes that work on that layer or on the layers below it are then eliminated from the scope of your problem. It might be clear that this method is most effective if the problem is on one of the higher OSI layers. The top-down method is one of the most straightforward troubleshooting methods because problems that are reported by users are typically defined as application layer problems, so starting the troubleshooting process at that layer is the obvious thing to do.
- A drawback of this method is that you need to access the application layer software on the machine of the client to initiate the troubleshooting process. If the software is installed on only a few machines, it might be difficult to test it properly.
- Bottom-up method: Work from the physical layer in the OSI model up to the application layer. The bottom-up approach also uses the OSI model as the guiding principle, but this time you start on the physical layer and work your way up to the application layer. By verifying, layer by layer, that the network is operating correctly, you steadily eliminate more potential causes and narrow the scope of the potential problems. For example, if you are researching the problem of a user who cannot browse a particular website, you would first verify physical connectivity. You would log in to the switch and verify the port status. After each test or verification step, you would move up through the layers of the OSI model.
- A benefit of this method is that all the initial troubleshooting takes place on the network, so access to clients, servers, or applications is not necessary until later in the troubleshooting process. Also, the thoroughness and steady progress of this method will give you a relatively high probability of eventual successor, at the very least, a decent reduction of the problem scope. A disadvantage of this method is that, in large networks, it can be a very time-consuming process, because much effort will be spent on gathering and analyzing data. Therefore, the best use of this method is to first reduce the problem scope by using a different strategy and then switching to this method for clearly bounded parts of the network topology.
- Divide-and-conquer method: Start in the middle of the OSI layers (usually the network layer) and then go up or down, depending on the results. If it is not clear whether the top-down or the bottom-up approach would be most effective, it can be helpful to start in the middle (typically the network layer) and run an end-to-end test, such as a ping. If the ping succeeds, you can assume that all lower layers are good, and you can start bottom-up troubleshooting. Conversely, if the test fails, you can start a top-down troubleshooting process.
- Whether the result of the initial test is positive or negative, this method usually results in a faster elimination of potential problems than you would achieve by implementing a full top-down or bottom-up approach, which makes the divide-and-conquer method a very effective strategy.
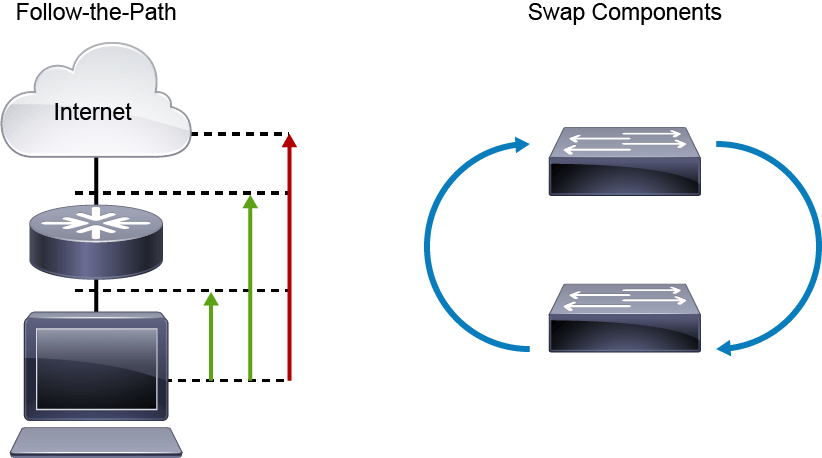
- Follow-the-path method: Determine the path that packets follow through the network from the source to the destination and track the packets along the path. Tracing the path of packets through the network eliminates irrelevant links and devices from the troubleshooting process. The objective of a troubleshooting method is to isolate the problem by eliminating potential problem areas from the scope of the troubleshooting process. By analyzing and verifying the path that packets and frames take through the network as they travel from the source to the destination, you can reduce the scope of your troubleshooting to just those links and devices that are actually in the forwarding path.
- Swap components method: Move components physically and observe if the problem moves with the components or not. This method is good to troubleshoot issues caused by the bad cable, for example. A common way to at least isolate the problem is to start swapping the components like cables, switches, switch ports, or NICs on the PC to confirm that the problem moves with the specific component. This method allows you to isolate the problem, even if the information that you can gather is minimal, just by executing simple tests in a methodical way. Even if you do not solve the problem, you have scoped it to a single element, and further troubleshooting can now be focused on that element.
- The drawbacks of this method are as follows:
- You are isolating the problem to only a limited set of physical elements. You are not gaining any real insight into what is happening, because you are gathering only very limited, indirect information.
- This method assumes that the problem is with a single component. If the problem is with a particular combination of elements, you might not be able to isolate the problem correctly.

Perform comparison method: Compare network devices or processes that are operating correctly to devices or processes that are not operating as expected. Gather clues by spotting significant differences.
Compare the configurations, software versions, hardware or other device properties, links, or processes between working and nonworking situations. If you see significant differences between them, you might be able to resolve the problem by changing the nonoperational situation to be consistent with the working situation. The biggest disadvantage of this method is that it can lead to a working situation, but not to an understanding of the root cause of the problem. Sometimes, you cannot even be sure if you have implemented a real solution or only a workaround. Here is an example.
You are troubleshooting a connectivity problem with a branch office router. You have managed to narrow down the problem to an issue with the default routing, but you cannot seem to find the cause. You notice that this router is an older type that was phased out in most of the other branch offices. You have one of the newer types of routers in the trunk of your car because you plan to install that in another branch office next week.
You decide to copy the configuration of the existing branch router to the newer router and replace it, and everything starts to work as expected. What do you do now? Do you consider the problem to be fixed? What was the root cause? What should you do with the old and new routers? As you can see, this method has several drawbacks, but it is still a useful technique because you can use it even when you lack the background to troubleshoot based on knowledge of the technology.
The effectiveness of this method depends on how easy it is to compare the working and nonworking devices, situations, or processes. Having a good baseline of what constitutes normal behavior on the network makes it easier to notice abnormal behavior. Also, the use of consistent configuration templates makes it easier to see the significant differences between functioning and malfunctioning devices. As a result, the effectiveness of this method depends on the quality of the overall network maintenance process.
Overview of the Troubleshooting Process
A structured troubleshooting process can be broken down in several phases.
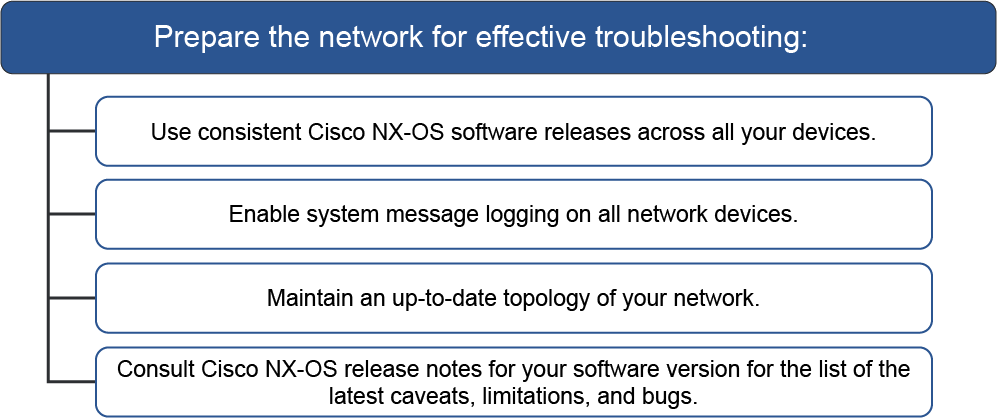
Effective troubleshooting starts with proper preparation. You should prepare your network for problem solving and ensure that all the relevant information is available when the problem occurs.
Ask yourself the following questions:
- Is the software version the same on all devices?
- It is important to keep consistent software releases on all devices. This approach helps narrow down problems to a single operating system release. It also makes it easier to compare device behavior and avoids unnecessary compatibility issues between software versions.
- Are all devices sending logs to outside servers?
- You should always configure your devices to store system logs to log servers. It is not enough to keep logs on the network devices themselves.
- Can I access an accurate and up-to-date topology of the network when I need it?
- When troubleshooting networking issues, you want to avoid wasting time determining if nodes are properly interconnected. Always have updated physical and basic logical topologies ready for use. Updated topologies will help you quickly eliminate trivial problems with basic connectivity.
- Can I anticipate potential problems?
- Read through the release notes for your Cisco Nexus Operating System (NX-OS) Software release. Sometimes, you will find out that certain releases do not support specific features, or that they have specific caveats with different hardware, software, or protocol combinations. For example, sometimes the software may accept certain command values, but hardware implementation does not support configured granularity.

After you have clearly identified the symptoms and determined that network issues are the likely cause of the problem, proceed with the general troubleshooting steps in the following order:
- Troubleshoot new configuration items: When implementing new configuration items, such as new protocols, always make sure that you are performing the changes only in this specific area. This approach will help you narrow down the problems to the new configuration. Make sure that you have installed the appropriate licenses and activated the required features.
- Gather relevant information: Use the CLI commands and analysis tools that you will encounter here to quickly familiarize yourself with the networking environment, identify an abnormal or unexpected state or behavior, and start narrowing down potential causes to specific problem areas. Look at the problem symptoms, device hardware and software state, basic physical connectivity, and Layer 2 and Layer 3 information. Compare this information with the expected state and the current network topology.
- Verify basic connectivity: Make sure that basic issues in physical connectivity, and Layer 2 and Layer 3 communication, are not causing the problem.
If all your efforts do not produce any results and you are unable to resolve the problem symptoms, consider contacting Cisco TAC. Before you contact them, gather all relevant information that will help the technical support team to understand your problem and familiarize themselves with your network, configuration, and the troubleshooting steps that you have attempted in problem resolution.
Gathering General Device Information
You can use the following commands to gather information about your device and physical, Layer 2, and Layer 3 connectivity.

Use the general commands to quickly assess the state of your device, Layer 2 topology, and Layer 3 routing. This step is the initial step in becoming familiar with the device and networking environment and eliminating obvious and trivial issues, such as module problems, unplugged interfaces, incorrect cabling, misconnected ports, and so on. Compare the gathered information with your network topology.
Use the show module the command to display module information for all I/O modules and supervisor modules in the chassis, and to quickly assess the hardware state. Note any modules that do not show the status ok.
Example:
switch# show module
Mod  Ports  Module-Type                         Model              Status
---  -----  ----------------------------------- ------------------ ----------
1    0      NX-OSv Supervisor Module            N7K-SUP1           active *
2    48     NX-OSv Ethernet Module              N7K-F248XP-25      ok
3    48     NX-OSv Ethernet Module              N7K-F248XP-25      ok
4    48     NX-OSv Ethernet Module              N7K-F248XP-25      ok

Mod  Sw               Hw      World-Wide-Name(s) (WWN)
---  ---------------  ------  --------------------------------------------------
1    7.2(0)ZD(0.120)  0.0     --
2    NA               0.0     --
3    NA               0.0     --
4    NA               0.0     --


Mod  MAC-Address(es)                         Serial-Num
---  --------------------------------------  ----------
1    00-50-56-89-4d-87 to 00-50-56-89-55-86  TM56894D87B
2    02-00-0c-00-02-00 to 02-00-0c-00-02-7f  TM56894D87C
3    02-00-0c-00-03-00 to 02-00-0c-00-03-7f  TM56894D87D
4    02-00-0c-00-04-00 to 02-00-0c-00-04-7f  TM56894D87E
Use the show version the command to display information about the installed software release. Also, note the device uptime that you can see in the command output. This information will alert you to recent, unexpected device reloads.
Example:
switch# show version
Cisco Nexus Operating System (NX-OS) Software
TAC support: http://www.cisco.com/tac
Documents: http://www.cisco.com/en/US/products/ps9372/tsd_products_support_serie
s_home.html
Copyright (c) 2002-2015, Cisco Systems, Inc. All rights reserved.
The copyrights to certain works contained herein are owned by
other third parties and are used and distributed under license.
Some parts of this software are covered under the GNU Public
License. A copy of the license is available at
http://www.gnu.org/licenses/gpl.html.

NX-OSv is a demo version of the Nexus Operating System

Software
  loader:    version N/A
  kickstart: version 7.2(0)D1(1) [build 7.2(0)ZD(0.120)]
  system:    version 7.2(0)D1(1) [build 7.2(0)ZD(0.120)]
  kickstart image file is: bootflash:///titanium-d1-kickstart.7.2.0.ZD.0.120.bin
  kickstart compile time:  3/8/2015 1:00:00 [03/08/2015 11:04:12]
  system image file is:    bootflash:///titanium-d1.7.2.0.ZD.0.120.bin
  system compile time:     3/8/2015 1:00:00 [03/08/2015 15:34:48]

Hardware
  cisco NX-OSv Chassis ("NX-OSv Supervisor Module")
  Intel(R) Xeon(R) CPU E5-2690 with 2996832 kB of memory.
  Processor Board ID TM56894D87B

  Device name: DC1-N7K-1
  bootflash:    1582402 kB

Kernel uptime is 15 day(s), 21 hour(s), 24 minute(s), 49 second(s)

plugin
  Core Plugin, Ethernet Plugin
Use the show running-config command to display the running configuration. Use the all statement to display the default and configured information.
Use the show interfaces brief the command to display brief information about all interfaces that are available on the device. Notice any interfaces that are not active, but should be active. The command will output the information about all interfaces—both physical and virtual.
Example:
switch# show interfaces brief

--------------------------------------------------------------------------------
Port   VRF          Status IP Address                              Speed    MTU
--------------------------------------------------------------------------------
mgmt0  --           up     10.1.1.22                               1000     1500

--------------------------------------------------------------------------------
Ethernet      VLAN    Type Mode   Status  Reason                   Speed     Port
Interface                                                                    Ch
#
--------------------------------------------------------------------------------
Eth2/1        1       eth  access down    Administratively down      auto(D) --
Eth2/2        1       eth  access down    Administratively down      auto(D) --
Eth2/3        1       eth  access down    Administratively down      auto(D) --
Eth2/4        1       eth  access down    Administratively down      auto(D) --
Eth2/5        1       eth  access down    Administratively down      auto(D) --
Eth2/6        1       eth  access down    Administratively down      auto(D) --
Eth2/7        1       eth  access down    Administratively down      auto(D) --
Use the show spanning-tree command to display information about the Spanning Tree Protocol (STP). Notice any ports that the STP blocks, but should not be blocked.
Example:
switch# show spanning-tree

VLAN0001
Spanning tree enabled protocol rstp
Root ID Priority 32769
Address 000d.eca3.9f01
Cost 4
Port 4105 (port-channel10)
Hello Time 2 sec Max Age 20 sec Forward Delay 15 sec

Bridge ID Priority 32769 (priority 32768 sys-id-ext 1)
Address 0022.5579.7641
Hello Time 2 sec Max Age 20 sec Forward Delay 15 sec

Interface Role Sts Cost Prio.Nbr Type
---------------- ---- --- --------- -------- --------------------------------
Po10 Root FWD 2 128.4105 (vPC peer-link) P2p
Po20 Desg FWD 1 128.4115 (vPC) P2p
Po30 Root FWD 1 128.4125 (vPC) P2p
Use the show ip route command to display the routes from the Unicast Routing Information Base (URIB). Determine if the default gateway is properly configured and if the routing table holds all IP routes.
Example:
switch# show ip route all
IP Route Table for VRF "default"
'*' denotes best ucast next-hop '**' denotes best mcast next-hop
'[x/y]' denotes [preference/metric]

0.0.0.0/32, 1 ucast next-hops, 0 mcast next-hops
*via Null0, [220/0], 00:45:24, local, discard
255.255.255.255/32, 1 ucast next-hops, 0 mcast next-hops
*via sup-eth1, [0/0], 00:45:24, local
Use the show ipv6 route command to display the IPv6 routes from the URIB.
Example:
switch# show ipv6 route
IPv6 Routing Table for VRF "default"

0::/127, ubest/mbest: 1/0
*via 0::, Null0, [220/0], 18:03:20, discard, discard
fe80::/10, ubest/mbest: 1/0
*via 0::, Null0, [220/0], 18:03:20, discard, discard
Use the show processes command to display process information for a device. Use the show process | include ER command to display processes that should currently be running but the system disabled. ER usually is the state that a process enters if it has been restarted too many times and has been detected as faulty by the system and disabled.
Use show accounting log command to display the accounting log content. When you make a configuration change on the system, the results are written in the accounting log. A configuration change displays one of the following three results:
- Success: This result indicates that the configuration change was successful.
- Failure: This result indicates that the configuration change was unsuccessful.
- Redirect: This result indicates that the configuration change was not issued directly from the CLI but was issued as a result of another CLI command.
Example:
switch# show accounting log
Sat Feb 16 10:44:24 2008:update:/dev/pts/1_172.28.254.254:admin:show system uptime
Sat Feb 16 10:44:25 2008:update:/dev/pts/1_172.28.254.254:admin:show clock
Sat Feb 16 10:45:20 2008:update:/dev/pts/1_172.28.254.254:admin:show logging log
Verifying Physical Ports
You should start the troubleshooting process by first eliminating the most obvious problems. There is no point in troubleshooting complex protocol and feature interactions if the physical connectivity between nodes is not working properly.
As the first step in problem resolution, you should consider the following aspects:
- Determine if the devices are interconnected according to your topology diagram.
- The cabling should be connected to the appropriate ports. The devices should be interconnected using the right ports. Sometimes the port can be in the Upstate and forward traffic, but it is not connected to the right port on the other side. If you are not sure whether a port on one device is connected to the proper port on the other devices, view the output of the show CDP neighbor command or quickly shut down the observed port and see the matching result on the other side.
- Eliminate any trivial connectivity issues such as loose cables.
- Determine if the port is allocated to the appropriate virtual device context (VDC) and is available in that VDC.
- Use the show vdc membership command to list all VDC interface allocations.
- Determine if all interfaces are in an operational state.
- You should know in advance which interfaces should be in an operational state. Use the show interface brief the command to quickly determine the statuses of all interfaces.
Verifying Layer 2 Connectivity
You can use the following commands to check Layer 2 connectivity.

Displaying information about interfaces shows you if some of the interfaces have been disabled due to higher layer features, such as port security. Other Layer 2 features, such as STP, may block traffic through the interface, while still maintaining the interface in operational state. Use the show commands to quickly access the state of Layer 2 connectivity and determine if there are any unexpected and undesirable changes in the topology, such as STP blocking.
Use the show vlan command to display VLAN information. Use the show vlan all-ports command to display all ports on VLANs.
Example:
switch# show vlan all-ports

VLAN Name Status Ports
---- -------------------------------- --------- -------------------------------
1 default active Po5, Po37, Po50, Eth2/1, Eth2/2
Eth2/3, Eth2/5, Eth2/7, Eth2/8
Eth2/9, Eth2/10, Eth2/15
Eth2/21, Eth2/22, Eth2/23
Eth2/24, Eth2/25, Eth2/26
Eth2/27, Eth2/28, Eth2/46
Eth2/47, Eth2/48
5 VLAN0005 active
6 VLAN0006 active
7 VLAN0007 active
8 test active
9 VLAN0009 active
10 VLAN0010 active
50 VLAN0050 active Eth2/6
100 trunked active
200 VLAN0200 active
201 VLAN0201 active
202 VLAN0202 active
Use the show port-channel summary command to display summary information about port channels. Notice any port channels that are not in the up (SU) state. The “D” flag will inform you that the interface is in the Down state; the “s” flag means that the port is suspended.
Example:
switch(config-if)# show port-channel summary
Flags: D - Down P - Up in port-channel (members)
I - Individual H - Hot-standby (LACP only)
s - Suspended r - Module-removed
S - Switched R - Routed
U - Up (port-channel)
M - Not in use. Min-links not met
--------------------------------------------------------------------------------
Group Port- Type Protocol Member Ports
Channel
--------------------------------------------------------------------------------
2 Po2(SU) Edge LACP Eth4/9(D) Eth4/10(D) Eth4/11(P) Eth4/12(P)

3 Po3(SU) Edge LACP Eth4/27(P) Eth4/28(P) Eth4/29(P) Eth4/30(P)
Use the show port-channel compatibility-parameters command to display the parameters that must be the same among the member ports to join a port channel.
Example:
switch# show port-channel compatibility-parameters
* port mode
Members must have the same port mode configured, either E or AUTO. If they
are configured in AUTO port mode, they have to negotiate E mode when they
come up. If a member negotiates a different mode, it will be suspended.
* speed
Members must have the same speed configured. If they are configured in AUTO
speed, they have to negotiate the same speed when they come up. If a member
negotiates a different speed, it will be suspended.
* MTU
Members have to have the same MTU configured. This only applies to ethernet
port-channel.
* MEDIUM
Members have to have the same medium type configured. This only applies to
ethernet port-channel.
* Span mode
Members must have the same span mode.
* sub interfaces
Members must not have sub-interfaces.
* Duplex Mode
Members must have same Duplex Mode configured.
* Ethernet Layer
Members must have same Ethernet Layer (switchport/no-switchport) configured.
* Span Port
Members cannot be SPAN ports.
* Storm Control
Members must have same storm-control configured.
* Flow Control
Members must have same flowctrl configured.
* Capabilities
Members must have common capabilities.
* port
Members port VLAN info.
* port
Members port does not exist.
* switching port
Members must be switching port, Layer 2.
* port access VLAN
Members must have the same port access VLAN.
* port native VLAN
Members must have the same port native VLAN.
* port allowed VLAN list
Members must have the same port allowed VLAN list.
Use the show running-config spanning-tree command to display the spanning-tree running configuration.
Example:
switch# show running-config spanning-tree
spanning-tree mode mst
spanning-tree mst 1 priority 24576
spanning-tree mst 2 priority 28672
spanning-tree mst configuration
  name CISCO
  revision 1
  instance 1 vlan 100-200
  instance 2 vlan 201-300
Use the show spanning-tree blockedports command to display the alternate ports that STP is blocking. Notice any Layer 2 ports that STP is blocking but should be in the Forwarding state.
Example:
switch(config)# show spanning-tree blockedports

Name Blocked Interfaces List
-------------------- ------------------------------------
VLAN0001 Eth8/2
VLAN0002 Eth8/2
VLAN0003 Eth8/2
VLAN0004 Eth8/2
VLAN0005 Eth8/2
VLAN0006 Eth8/2
VLAN0007 Eth8/2
VLAN0008 Eth8/2
VLAN0009 Eth8/2
VLAN0010 Eth8/2
Use the show mac address-table command to display information about the MAC address table. Use the show mac address-table dynamic vlan vlan_number to display the dynamic information about the MAC address table for a specific VLAN. You will find this command most useful for determining if an access port is learning the MAC addresses from the connected devices, therefore indicating that a basic packet exchange works on Layer 2.
switch# show mac address-table dynamic
 Note: MAC table entries displayed are getting read from software.
 Use the 'hardware-age' keyword to get information related to 'Age'

 Legend:
        * - primary entry, G - Gateway MAC, (R) - Routed MAC, O - Overlay MAC
        age - seconds since last seen,+ - primary entry using vPC Peer-Link, E – EVPN entry
        (T) - True, (F) - False ,  ~~~ - use 'hardware-age' keyword to retrieve age info
  VLAN/BD   MAC Address      Type      age     Secure NTFY Ports/SWID.SSID.LID
Verifying Layer 3 Connectivity
When troubleshooting Layer 3 connectivity problems, which are usually manifested as receiving no response to ping packets, start by checking basic Layer 3 connectivity. Inspect the Address Resolution Protocol (ARP) tables to see if the port exchanges IP information with the connected device. Then, check the IP routing table.

Before attempting to troubleshoot Layer 3 connectivity, you must understand where in your network any specific policies may block or disallow pings. You want to avoid wasting time troubleshooting IP connectivity in cases where you do not receive any ping responses because of access list filtering. To display IP information for an interface, use the show ip interface command.
Example:
switch# show ip interface ethernet 1/2

IP Interface Status for VRF "default"(1)
Ethernet1/2, Interface status: protocol-up/link-up/admin-up, iod: 6,
  IP address: 172.10.0.1, IP subnet: 172.10.0.0/30 route-preference: 0, tag: 0
  IP broadcast address: 255.255.255.255
  IP multicast groups locally joined:
      224.0.0.22  224.0.0.13  224.0.0.2  224.0.0.1
  IP MTU: 1500 bytes (using link MTU)
  IP primary address route-preference: 0, tag: 0
  IP proxy ARP : disabled
  IP Local Proxy ARP : disabled
  IP multicast routing: enabled
  IP icmp redirects: disabled
  IP directed-broadcast: disabled
  IP Forwarding: disabled
  IP icmp unreachables (except port): disabled
  IP icmp port-unreachable: enabled
  IP unicast reverse path forwarding: none
  IP load sharing: none
  IP interface statistics last reset: never
  IP interface software stats: (sent/received/forwarded/originated/consumed)
    Unicast packets    : 14/34/0/24/42
    Unicast bytes      : 1428/2712/0/2268/3528
    Multicast packets  : 7063/1045/0/7063/1045
    Multicast bytes    : 381402/1565410/0/381402/1565410
    Broadcast packets  : 0/0/0/0/0
    Broadcast bytes    : 0/0/0/0/0
    Labeled packets    : 0/0/0/0/0
    Labeled bytes      : 0/0/0/0/0
  WCCP Redirect outbound: disabled
  WCCP Redirect inbound: disabled
  WCCP Redirect exclude: disabled
Use the show ip arp command to display the ARP information.
Example:
switch# show ip arp

Flags: * - Adjacencies learnt on non-active FHRP router
       + - Adjacencies synced via CFSoE
       # - Adjacencies Throttled for Glean
       D - Static Adjacencies attached to down interface

IP ARP Table for context default
Total number of entries: 0
Address         Age       MAC Address     Interface
Use the show ip route command to display the routes from the URIB. Example
switch# show ip route all
IP Route Table for VRF "default"
'*' denotes best ucast next-hop '**' denotes best mcast next-hop
'[x/y]' denotes [preference/metric]

0.0.0.0/32, 1 ucast next-hops, 0 mcast next-hops
*via Null0, [220/0], 00:45:24, local, discard
255.255.255.255/32, 1 ucast next-hops, 0 mcast next-hops
*via sup-eth1, [0/0], 00:45:24, local
You can also use Cisco NX-OS show interface command for troubleshooting, which has some similarities with the ipconfig command in Windows, and the ifconfig command in Linux, but it includes many more performance counters and status indicators. Also, because Cisco NX-OS devices have many more interfaces than the average Windows or Linux host, the amount of output is multiplied by the increase in interface count.
The pipe parameter (|) can be placed at the end of any CLI command to qualify, redirect, or filter the output of the command. Many advanced pipe options are available including the following:
grepand extended get regular expression (egrep)no moreheadandtail
The pipe option can also be used multiple times or recursively.
When command output exceeds the length of the screen, the –More– prompt is displayed. When a –More– prompt is displayed, enter h to see a list of available options within the more context.
The egrep parameter allows you to search for word or expression, print a word count, and other options.
For example, the show spanning-tree | egrep ignore-case next 4 rstp command performs the following functions:
- The
show spanning-treecommand output is piped toegrep. - The first
egrepparameter specifies that the character match for the regular expressionrstpis not to be case-sensitive. - The second
egrepparameter specifies that if a match is found, only the next four lines following the match are also to be displayed.
You can find what commands are available for what features using below commands:
show tech ospf | eg -i `show
switch# show tech ospf | eg -i `show
`show running-config ospf`
`show running-config rpm`
`show ip ospf internal event-history cli`
`show ip ospf vrf all`
`show ip ospf ha vrf all`
show cli syntax | eg -i links
switch# show cli syntax | eg -i links
(2513) show ip ospf [ <tag> ] virtual-links brief [ vrf { <vrf-name> | <vrf-known-name> |
(2514) show ip ospf [ <tag> ] virtual-links [ vrf { <vrf-name> | <vrf-known-name> |
(2515) show ip ospf [ <tag> ] sham-links [ brief ] [ vrf { <vrf-name> | <vrf-known-name> |
Content Review Question
Which troubleshooting method works from the physical layer in the OSI model up to the application layer?
- bottom-up
- divide-and-conquer
- top-down
- perform comparison
Answer
The correct answer is: “bottom-up,” the other options are distractors. Bottom-up method: Work from the physical layer in the OSI model up to the application layer
1.3 Describing the Troubleshooting Process
Troubleshooting Overview and Issue Identification
In this topic, we will be discussing tools that we use very commonly to troubleshoot in the Cisco IOS and NX-OS. Now, as you can see here, folks, we do have a couple of different things that we can talk about. So, first of all, the debug– debug is very, very important, folks, because it’s going to show you in real-time what’s going on. So, for instance, let’s say that we’re trying to troubleshoot CHAP authentication, where we want both sides to authenticate and bring the link-up.
What happens if that link is not actually coming online? What we can do is we can debug the authentication and the interface to try and see in real-time what’s going on. 9 times out of 10, you’re probably going to see that it’s some sort of authentication issue with a username and password.
We also have our common, standard ping and traceroute. So, ping– what it allows me to do is send out a message to an end device, trying to see if that device is online. Hopefully, if it is, it should respond back with a reply. We’re using what we call echo requests and echo replies to try and verify that the other side is, in fact, on line.
Now, traceroute– this employs a little bit of ping, but it’s a little bit different. What it’s going to do is it’s going to send a message to each device on the path and tracing that route from start to finish, wherever you’re troubleshooting from to the end device. Now, this is very important, folks, because this is going to give us, obviously, the path from one device to another. But, more importantly, it also tells us which devices are actually online in the path from start to finish.
Now, we also have the standard CLI. With the standard CLI, folks, this is our show run, show interface, our show commands. These are commands that once you’re inside the CLI, you can get in-depth on what’s going on with a specific feature or function. For instance, let’s say that we enabled OSPF. If OSPF is not receiving any routes, how do we know that?
Well, usually, we’re going to do a show IP route. By doing a show IP route, you’ll notice that there are actually no routes in the routing table. So what we can do is go further and maybe check our neighbor adjacencies. So I might do a show IP OSPF neighbor just to verify that it is currently online. And if it is, maybe there’s another problem.
So, with that being said, the last thing we talk about here is our engineering CLI. There are a plethora of different things that we can talk about here, but one of my favorites is an embedded event manager in the scheduler. What it allows us to do, is watch for specific conditions and see if whenever that condition is met, would we like to send maybe an email or maybe reboot a module or a device. This is very, very important, the difference between standard and engineering. Standard is just standard CLI show commands, whereas engineering allows us to do something once a condition is met.
Use a symptoms-based approach to quickly identify the potential causes and the most appropriate course of action. You will familiarize yourself with the symptoms of different problems that are related to each technology. They help you pinpoint a potential cause of the problem, narrow down the troubleshooting tools that you should use, and determine the protocol or technology that was affected. It is important that you systematically rule out any general issues so that you can focus on troubleshooting a particular problem area.

Having eliminated the most obvious problem causes, you will be able to focus on finding the root cause of the problem and resolving the issue. Start by verifying physical connectivity and eliminating any problems that are related to interfaces or cabling.
Continue with a quick overview of Layer 2 (spanning tree, virtual port channel [vPC]) and Layer 3 topology and connectivity. Determine if spanning tree blocks ports that should not be blocked and if all required routes are present in the routing table. Use ping and traceroute commands to quickly verify end-to-end connectivity.
In addition to eliminating any connectivity issues, rule out the basic configuration issues such as missing or improperly configured commands. Do this elimination by comparing the configuration of the affected devices with the configuration of the devices that have similar functionality but do not exhibit the same symptoms. If you encounter problems with end-to-end communication, use the Switched Port Analyzer (SPAN) to capture traffic and prove that the packets are properly exchanged with endpoints.
Troubleshooting network issues may be a very complex process. It requires a deep understanding of the protocol operation of many complex protocols. It also requires intimate knowledge of the current network topology and the expected state of each hardware and software component. You can use this knowledge to effectively recognize if problem symptoms relate to network issues and narrow down any potential problem causes. You should start the troubleshooting process by asking the right questions. Asking the right questions will help you focus your efforts on the areas that are most likely to produce results, gather useful information, and prepare for potentially contacting Cisco TAC.
Answer these questions before contacting Cisco TAC:
- On which devices and ports is the problem occurring? How many devices have the same problem?
- In your network or fabric, what are the Cisco NX-OS Software, driver, operating system, and firmware releases?
- What is the normal or expected behavior? Do you have a baseline?
- What is the network topology? Where is the affected device connected?
- What changes did you make before the event? Did you implement new features on the affected devices?
- Do you always see the same problem under the same circumstances?
- Are there devices in the network with similar configuration that do not show the same problem?
- When did the problem first occur? How often does the problem occur?
- What troubleshooting steps did you take? Do you have any traces or debug outputs from your troubleshooting attempts?
When contacting Cisco TAC, you need to provide all the relevant data, so that they can quickly get an overview of the situation, start the troubleshooting process, and avoid repeating steps that you have already attempted.
Problems Related to Software Upgrade
When preparing for a Cisco NX-OS Software upgrade, make sure that you understand the upgrade procedure, any prerequisites, software release dependencies, and a potential incremental upgrade procedure. Sometimes, you have to perform an upgrade from the current software release to a gateway release and then to the target release. Also, make sure that you understand under which conditions a nondisruptive in-service software upgrade (ISSU) procedure is possible.
Answer the following questions after an unsuccessful software upgrade attempt:
- What was the original Cisco NX-OS release?
- What is the new Cisco NX-OS release?
Use the output of the listed show commands to gather the required information after an unsuccessful software upgrade.

Use the show install all status command to display a high-level log of the installation.
The show system internal log install details command displays detailed logs of the last installation-related command.
To view the NVRAM logs, use the show logging nvram command.
Copying Files and Configuration
Cisco NX-OS Software always serves as a file client. You cannot configure it to act as a file server. You will be able to initiate file downloads from or file uploads to outside servers using different available protocols, such as Secure Copy Protocol (SCP), FTP, Secure FTP (SFTP), and TFTP.
The device should regularly save and copy configuration files to an outside server, at least once per day and after any configuration change. Make sure that you always have access to the stored configuration files during the troubleshooting process. Periodically check if the configuration store procedure is operating normally.
You should regularly back up the startup configuration and always before you make any changes. The simplest way to back up the configuration is to create a run script. First, you will need to create a file with copy commands and then create a script using the listed commands.
switch# show file bootflash:config_save.txt
copy running-configuration startup-configuration
copy startup-configuration tftp://10.10.10.10/N7K-1-startup.cfg

switch# run-script bootflash:config_save.txt

switch# copy startup-config scp://username@server_ip/file_path/file_name
You can securely export the gathered information, such as the tech-support output or core dumps, using an SCP with the command copy startup-config scp://username@server_ip/file_path/file_name.
Preparing Information for a Cisco TAC Case
When you open a support case with Cisco TAC, a Cisco support engineer will probably ask you to provide the tech-support information from the affected devices. Take the following steps to get the information that you will need when you open a case with Cisco TAC.
When opening a TAC case, always generate a tac-pac command output and attach the file to the case. This allows Cisco TAC engineers to obtain information about the issue without having to ask for a show tech-support command output. The tac-pac command collects useful information which is then stored in a compressed file.
The following guidelines are detailed recommendations for gathering the information:
- Log the command output to a text file.
- Ensure that your terminal application has a large scroll buffer.
- Configure automatic scrolling of the output text in the terminal application by using the
terminal length 0command. - Issue the
show tech-support detailscommand. - Copy the command output to a text file.
- Save the command output to a local file system.
- Use the
tac-pacfilenamecommand (for example,tac-pac bootflash://sh_tech_N7K-1). - Upload the file to your file server using SCP, TFTP, or a similar protocol, and use gzip to compress the file.
- Use the
- If you are troubleshooting a Cisco Data Center Network Manager (DCNM) problem, an error may be displayed in the application window. Use screen capture to take a screenshot of the error and paste it into a document (for example, Microsoft Word), and save the file.
You can also use the following commands:
show tech-support goldto display general on-line diagnostics tech-support informationshow tech-support module allto gather the information that is related to all modules in the systemshow tech-support hato gather detailed information for high-availability troubleshootingshow tech-support<feature> to gather feature specific detailed information
switch# show tech-support otv > bootflash:tech-otv.txt
switch# dir bootflash: | eg -i tech
4873 Jan 26 11:02:06 2019 tech-otv.txt

switch# show ip route vrf all >> bootflash:tech-otv.txt
switch# dir bootflash: | eg -i tech
10385 Jan 26 11:17:11 2019 tech-otv.txt
You can redirect show tech-supportcommand output to a file using > and also append additional outputs to an existing file using >>.
Content Review Question
Which two questions should you answer before contacting Cisco TAC? (Choose two.)
- How many devices are affected by the same problem and where are they located?
- Who configured the recent changes?
- What are the changes that were applied and on which devices?
- Did reloading the affected devices resolve the issue?
- Did power cycling the affected devices resolve the issue?
- Did reset to the default values for the affected devices resolve the issue?
Answer:
The correct answers are: “How many devices are affected by the same problem and where are they located?” and “What are the changes that were applied and on which devices?.” Answer these questions before contacting Cisco TAC: On which devices and ports is the problem occurring? How many devices have the same problem?; What changes did you make before the event? Did you implement new features on the affected devices?
Q & A
Question 1
Several configuration changes were applied to the data center LAN network during recent maintenance. You are a data center network support engineer. You are investigating possible communications issues between two servers in the data center, which were reported after the maintenance window. Generally, which two steps should you take to troubleshoot your network? (Choose two.)
- Rollback the configuration to a known working state and do not implement changes.
- Contact the Cisco TAC.
- Verify end-to-end connectivity for both Layer 2 and Layer 3.
- Make sure that all the required features are activated and appropriate licenses are installed.
- Reload all devices as soon as possible.
Question 2
Working as a network support engineer for a company, you receive a complaint about a communication problem between two switches in the data center. During your troubleshooting process, you suspect that the issue is related to Layer 2 connectivity. Using troubleshooting commands, you were able to get some information that can help you locate the problem. Which two options could indicate Layer 2 problems? (Choose two.)
- The spanning-tree root switch is using the lowest STP priority.
- One port-channel member is marked with a D flag.
- One port-channel member is marked with an s flag.
- One port-channel member is marked with a P flag.
- The port-channel group is marked with an S flag.
- The spanning-tree priority on both switches is configured to the same value
Question 3
Which troubleshooting method would you typically use to verify that you have a bad cable?
- top-down
- bottom-up
- follow-the-path
- divide-and-conquer
- swap-components
Question 4
After adding a new server to the data center, you receive a complaint from the system administrator that the new server is not reachable using a remote desktop. Using out-of-band management on the new server, the system administrator is able to ping the default gateway, but not the management host that is used for the remote desktop that is located in the separate management network. Which two commands should you use to identify a problem with Layer 3 connectivity? (Choose two.)
show ip routeshow ip interfaceshow mac address-tableshow default-gatewayshow processes
Question 5
Which command displays processes that should be currently running but that the system has disabled?
show processes vdcshow processes log detailsshow processes cpu | include ERshow processes memory clisshow processes log pid
Question 6
Which command should you use to verify the parameters that must be the same among member ports to establish a port channel?
show port-channel summaryshow port-channel compatibility-parametersshow port-channel compatibility paramshow port-channel compatible
Question 7
Which protocol should you use to securely export gathered information, such as the tech-support output or core dumps?
- TFTP
- Telnet
- HTTP
- SCP
2.1 Understanding CLI Troubleshooting Tools
- Ping, Pong, and Traceroute
- Debugging, Event History, and System Monitoring
- SPAN and Encapsulated Remote SPAN
- Ethanalyzer, ELAM, and Data Plane Sampling Capture
- Logging
- Cisco Generic Online Diagnostics
- SNMP, Cisco EEM, and RMON
- Document the Network Baseline
MORE ON SUCH TOPICS
COMING SOON.. BOOKMARK THIS PAGE.